Incident Navigation
Incident Navigation
Incident Navigation explains how analysts move from the incident list into the incident workspace, review the available context and switch between the standard editor and type-specific views. This guidance is shared by the Dashboard and Case Management areas because both route users into the same underlying incident-management experience.
Scope of this page
This page focuses on how to navigate incidents and understand the layout of the available views. The Actions section is referenced because it is a common part of the editor, but the exact actions shown can vary depending on incident type, enabled integrations, automation options and user permissions.
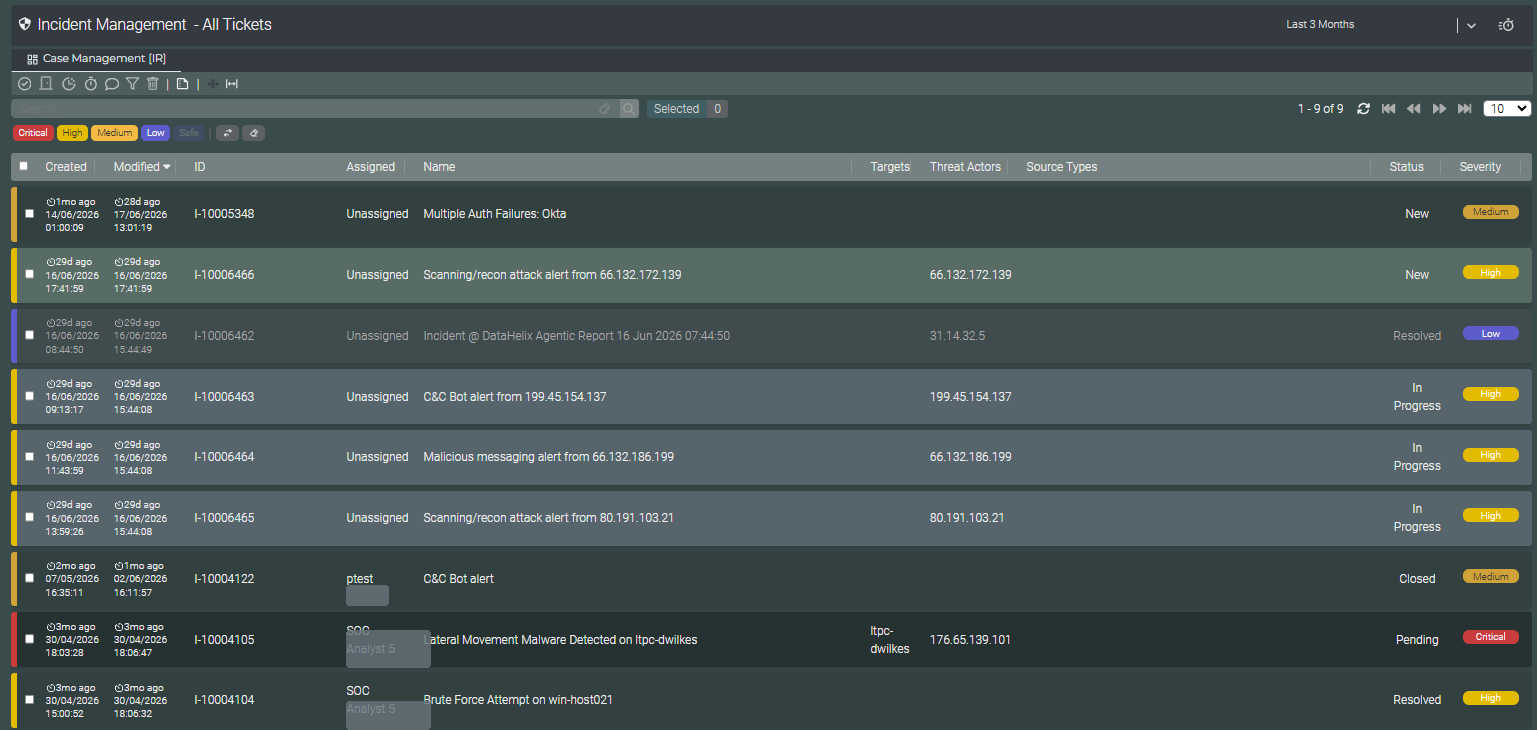
The Incident Table
In most workflows, analysts begin from the incident table. The table provides a concise operational view of current and historical incidents, allowing users to scan volume, identify priority items and select a record for further investigation.
Working list of incidents
Each row represents an incident and surfaces key values such as creation time, modification time, incident identifier, assignment, incident name, targets, threat actors, status and severity.
Filtering and triage
The table includes controls for narrowing the visible results, including severity chips and search/filter tools. This helps analysts quickly focus on high-priority or newly assigned work.
Open an incident
Selecting an incident opens the incident editor, where the full context, summaries, related evidence and type-specific content are presented.
Status awareness
Visual severity badges and status values help analysts distinguish new, in-progress, pending, resolved and closed work before opening the record.
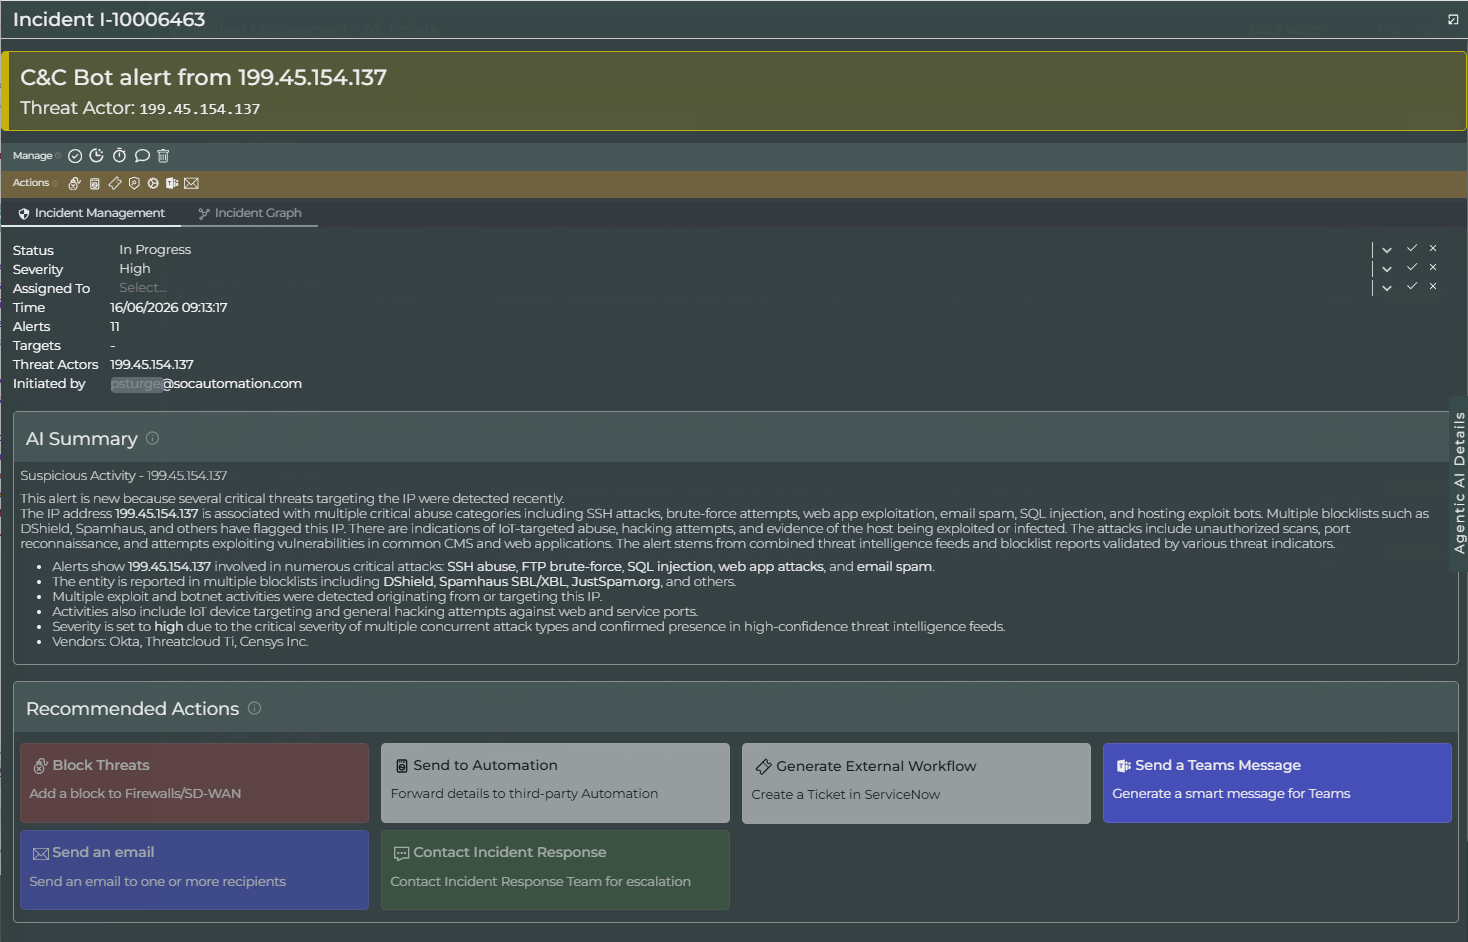
Incident Editor
Once an incident is opened, the incident editor becomes the primary workspace. The top area identifies the incident and presents the manage and actions controls. Below this, the main editor view presents the incident details, AI-generated summary content and the action area relevant to the current incident.
Incident header
The header provides the incident number, title and key context such as threat actor or target information. It allows the analyst to confirm immediately that the correct incident has been opened.
Incident Management tab
This tab presents the standard incident details, including fields such as status, severity, assignment, time, alert counts and related identifiers.
AI summary and contextual content
Where available, the editor includes generated summaries and contextual explanations to help analysts understand what has happened, why the incident matters and which notable indicators or behaviours have been identified.
Actions area
The Actions area is used to present available response or workflow options. The options shown here are not fixed: they depend on the incident type, the integrated products and services available to the tenant and the current SOCAutomation configuration.
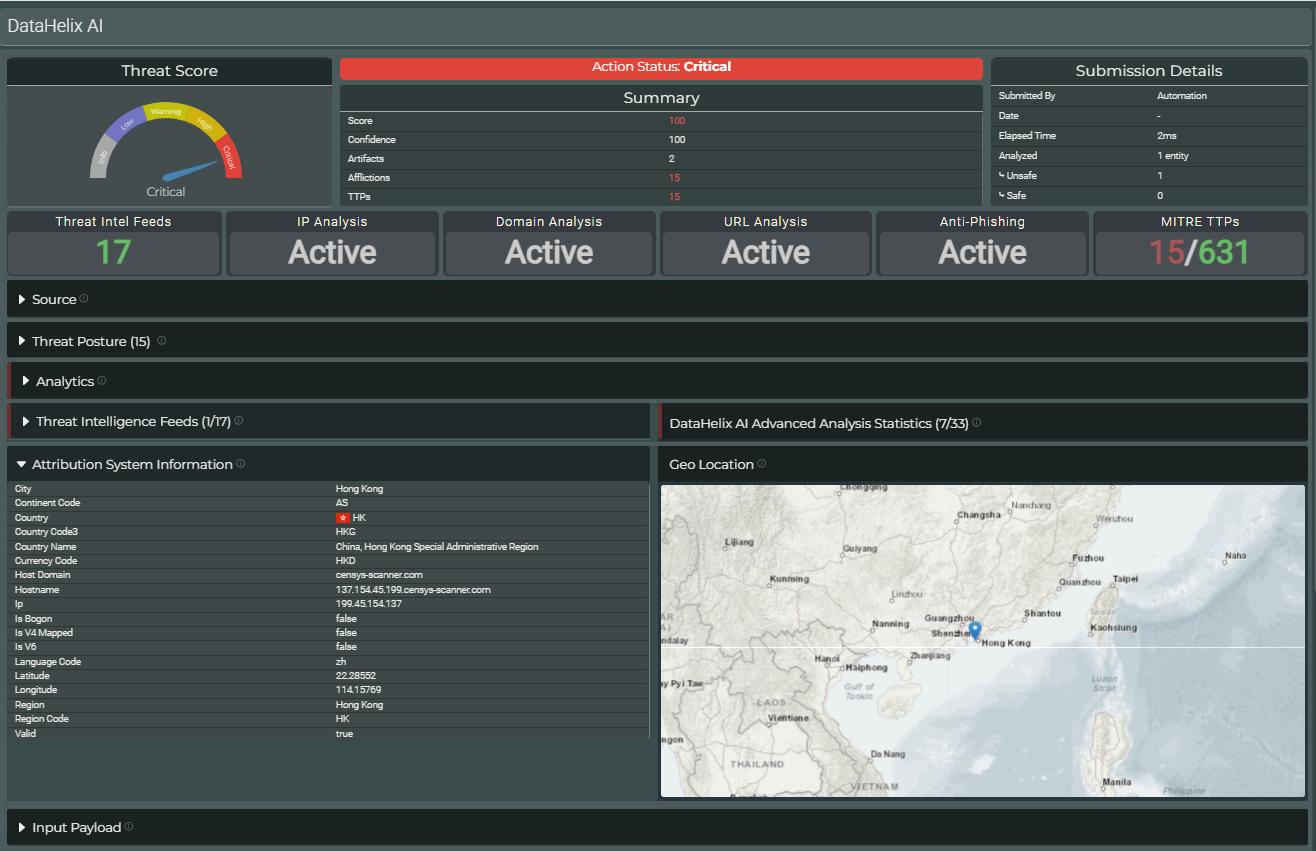
DataHelix AI Incident Details
DataHelix AI incidents use a richer analytical layout. These incidents typically surface an overall threat score, an action status, summary values, enabled analysis modules and additional enrichment panels that help analysts assess the entity under review.
Score and status
The top panels highlight the assessed threat score and the resulting action status, giving analysts a rapid indication of severity and confidence.
Analysis modules
Module tiles such as IP analysis, domain analysis, URL analysis, anti-phishing and MITRE coverage show which enrichment or analytical components contributed to the overall finding.
Expandable evidence sections
Collapsible sections provide access to source information, threat posture, analytics, threat-intelligence feeds, attribution information, geolocation and additional payload content.
Entity-centric review
These pages are designed to support a deeper review of a specific entity, showing the most important analysis and enrichment in one place before further response action is taken.
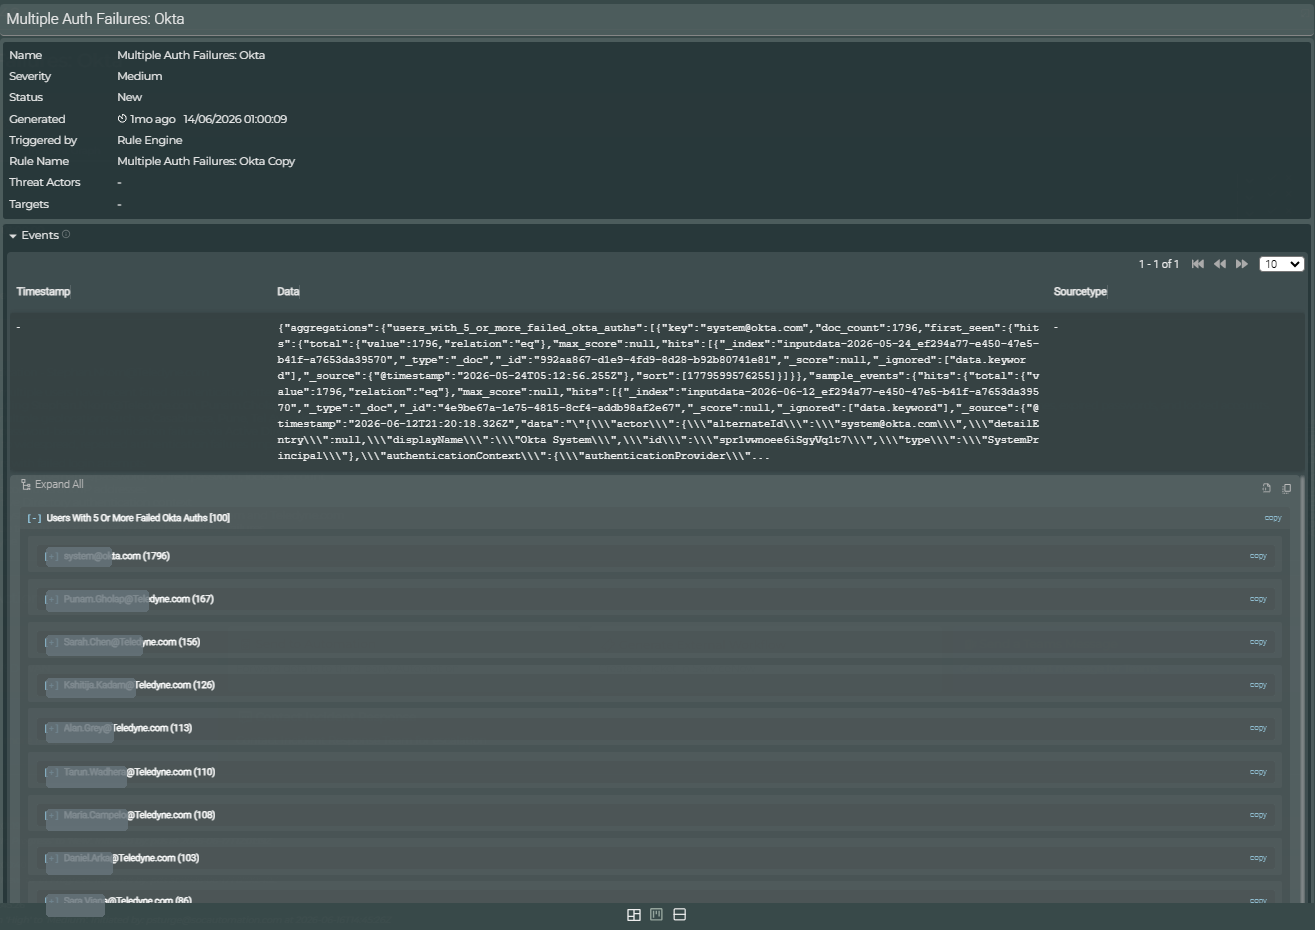
Rule Engine Incident Details
Rule Engine incidents typically focus on the results of a rule match and the underlying event content that triggered it. The upper summary confirms the key metadata, while the lower portion provides the source event data and any grouped or expanded results relevant to the rule output.
Summary fields
Use the summary section to confirm the incident name, severity, status, generation time, triggering source and associated rule details.
Event evidence
The events area contains the data returned by the rule. This may include the raw event content, grouped output, extracted fields or expanded result sets that support analyst validation.
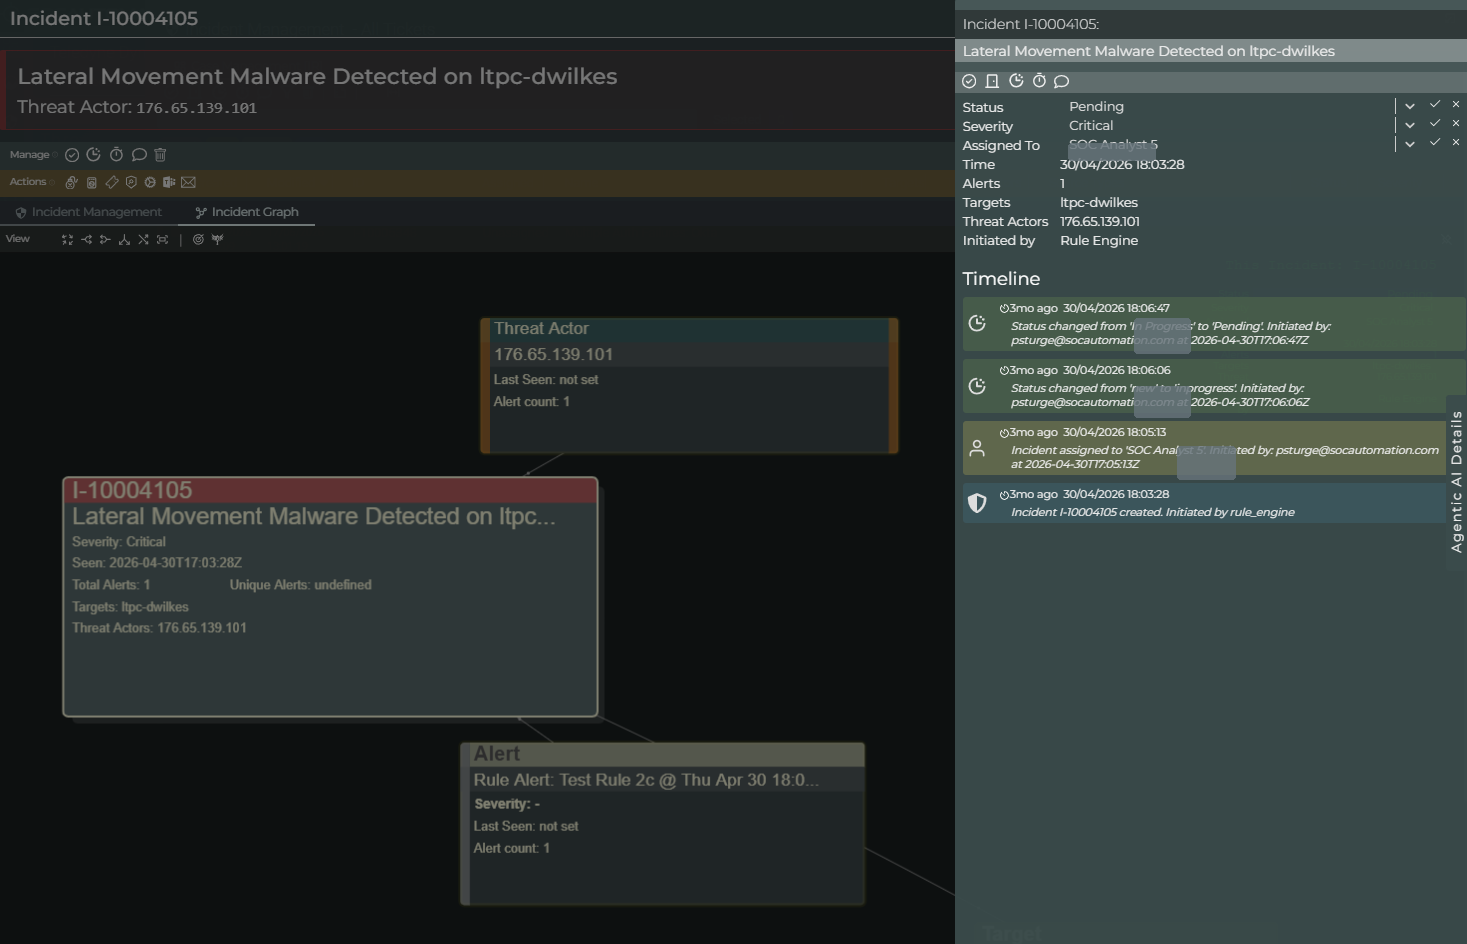
Incident Graph View
The Incident Graph tab provides an alternative way to view the same incident information. Rather than presenting the content only as fields and sections, it shows the incident as a node graph, enabling analysts to visualise relationships between the incident, alerts, threat actors, targets and other connected entities.
Node graph view
The graph helps analysts see how the central incident connects to related entities and evidence. This can make it easier to understand structure, relationships and pivot points during investigation.
Supporting details panel
The side panel retains key incident details and timeline information while the graph is in view, so analysts can move between relationship analysis and core incident context without leaving the page.
Practical navigation pattern
A typical workflow is: start in the incident table, open the required incident, review the standard incident details, examine the type-specific content for that incident. Use the Incident Graph tab when a relationship view would help the investigation.
Video walkthrough placeholder
Add an embedded walkthrough for this section by inserting an <iframe> or <video> element and applying the is-visible class to this container.