CyberFlow
Sidebar: Debug messages
The Debug sidebar displays messages passed to Debug nodes within the flow, as well as certain log messages from the runtime.
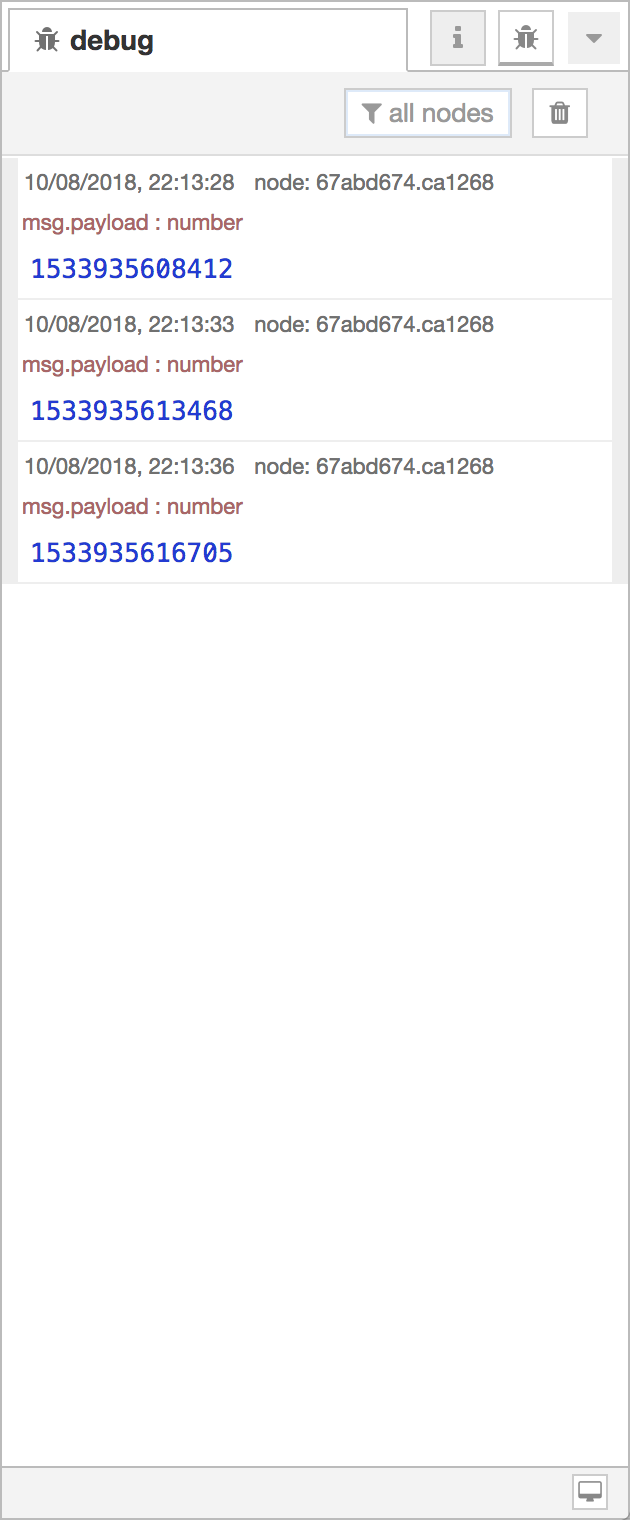
Debug messages Sidebar
For more information on how to use the Debug sidebar to understand the structure of messages, read the Working with messages guide.
| Reference | |
|---|---|
| Action | core:show-debug-tab |
| Key shortcut | Ctrl/⌘-g d |
By default, the Debug sidebar shows all messages passed to it. This can be filtered by clicking the button to open the filter options panel.
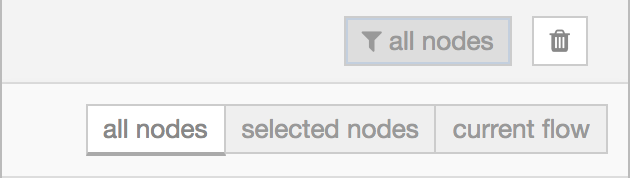
Debug filter options
The panel provides three options:
- all nodes - displays all messages
- selected nodes - select particular Debug nodes from a list of all available nodes
- current flow - only displays messages from nodes on the current flow in the workspace
Note: the Debug sidebar can only show the 100 most recent messages. If the sidebar is currently showing a filtered list of messages, the hidden messages still count towards the 100 limit. If a flow has noisy Debug nodes, rather than filter them from the sidebar it can be better to disable them by clicking their button in the workspace.
The sidebar can be cleared at any time by clicking the button.
| Reference | |
|---|---|
| Action | core:clear-debug-messages |
| Key shortcut | Ctrl/⌘-Alt-l |
The button in the sidebar footer can be used to open a separate browser window containing the Debug sidebar.
| Reference | |
|---|---|
| Action | core:activate-selected-debug-nodes |
| Reference | |
|---|---|
| Action | core:activate-all-debug-nodes |
| Reference | |
|---|---|
| Action | core:activate-all-flow-debug-nodes |
| Reference | |
|---|---|
| Action | core:deactivate-selected-debug-nodes |
| Reference | |
|---|---|
| Action | core:deactivate-all-debug-nodes |
| Reference | |
|---|---|
| Action | core:deactivate-all-flow-debug-nodes |
Video walkthrough placeholder
Add an embedded walkthrough for this section by inserting an <iframe> or <video> element and applying the is-visible class to this container.